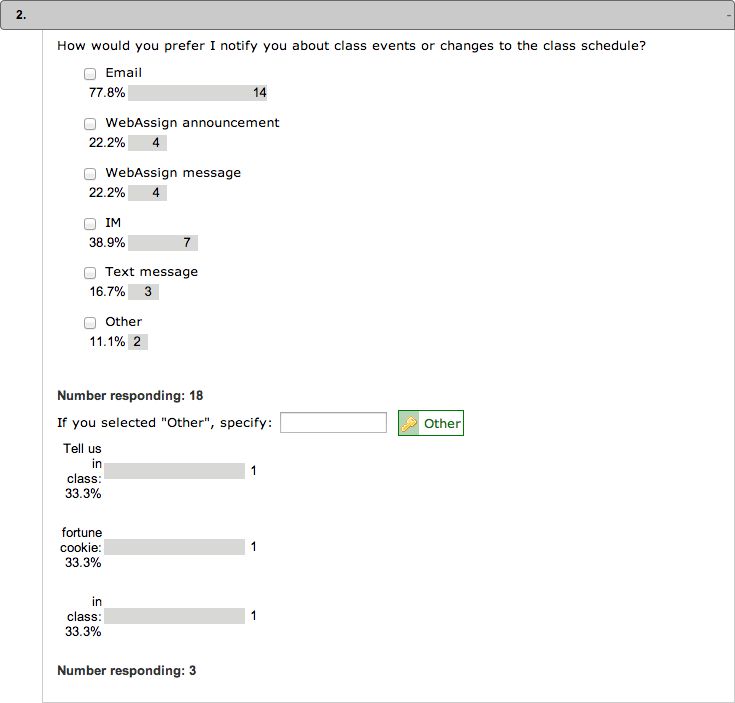
The Grades Response Summary page displays the distribution of student answers in one class section for each question on an assignment.

- Each answer choice displays a bar graph representing the percentage and number of students in the class who selected each answer.
- The graphed information represents the last submitted answers for each student in your class, even if your assignment is scored using the best answers.
- At the bottom of each question part, Number responding lists the number of students in the class who answered that question part.
For numerical, symbolic, and image map questions, a distribution is shown indicating only whether the answer was correct or incorrect.
For essay mode questions, each answer is listed, but no distribution information is shown.
For all other questions — including calcPad®, mathPad, and physPad® questions — no distribution information is shown at all.
For a multiple-select question, the number and percentage of students selecting each choice will usually be greater than the number of students responding because each student can select more than one choice.

For a free-response question, the distribution information might not be very useful, but each different student answer is shown.
For a randomized numerical question, one sample randomization is shown and the distribution reflects correct and incorrect answers rather than specific numeric responses.

Actions
You can perform a number of activities from the Grades Response Summary page.
| To do this | Do this | More information |
|---|---|---|
| See another assignment | Select the assignment you want to see in the Other Assignments menu. | |
| View the assignment in the Assignment Previewer | Click View. | Preview an Assignment |
| Edit the assignment | Click Edit. | Edit an Assignment |
| View or change the assignment’s schedule dates | Click Schedule. | Schedule Assignments |
| View your students' scores for the assignment | Click Scores. | Scores Page for an Assignment |