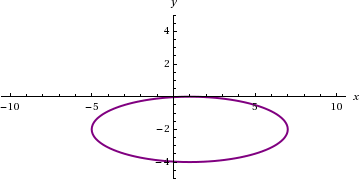
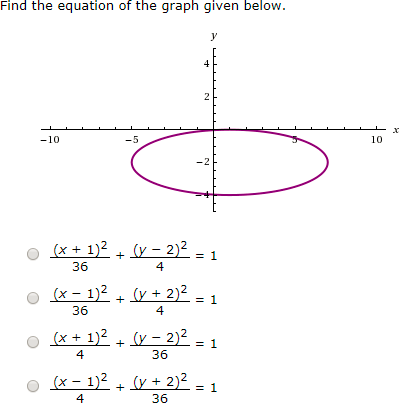
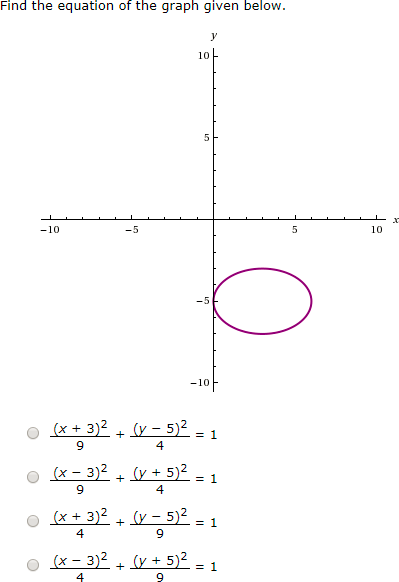
Graph a contour plot using Mathematica® syntax.
Graphing a Contour Plot
The following table summarizes an actual question.
|
QID |
|
|---|---|
|
Name |
|
|
Mode |
|
|
Question |
|
|
Answer |
|
|
Display to Students |

|
Graphing a Randomized Contour Plot
The following table summarizes an actual question.
Click the link to duplicate the example as a question in WebAssign.
Note You must be logged into WebAssign for a
template link to function.
|
QID |
|
|---|---|
|
Name |
|
|
Mode |
|
|
Question |
|
|
Answer |
|
|
Display to Students |

|
Was this helpful?
Thank you for your feedback.