You can monitor the class performance on each assignment using the Class Analysis page.
| Heading | Description |
|---|---|
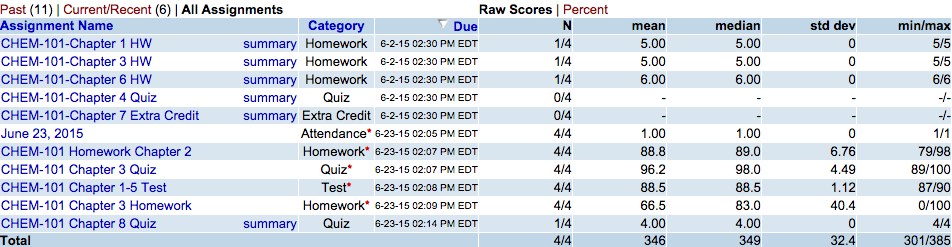
| Assignment Name | The name of the assignment, with links to view the student's answers and an activity log. |
| Summary | Links to the specific assignment with the correct answers and number of attempts on each question. |
| Category | The assignment type. |
| Due | The assignment due date. |
| N | The number of students scores per submission. |
| mean | The arithmetic mean for all student submissions. |
| median | The median score for all student submissions. |
| standard deviation | The standard deviation of scores for submitted questions. Lower standard deviations mean the values are tightly clustered; higher standard deviations mean the values are more widely scattered. |
| min/max | The lowest and highest scores or times to complete submitted questions. |
- A red asterisk (*) beside a score indicates the score has been changed by the instructor.
Actions
You can perform a number of activities from the Class Analysis page.| To do this | Do this | More information |
|---|---|---|
| View the distribution of student answers for each question on each assignment | Click summary | Grades Response Summary Page |
| View assignment analysis | Click the assignment name | Scores Page for an Assignment |
| View data as percentages | Click Percent | |
| View data using the raw scores | Click Raw |
Was this helpful?
Thank you for your feedback.