Lab 10: Summation Notation and the Concept of Area
The following material should be read prior to attending lab. You are responsible for preparing for lab so that you don't slow down your group.
One of the biggest problems in calculus that you will learn to solve this semester is referred to as 'the area problem,' where you will be asked to find the area under a curve or between two curves. Before you can solve 'the area problem,' you need a refresher course in some aspects of algebra and geometry.
Summation Notation
Suppose you encounter the following problem, $1 + 3 + 5 + 7 + 9 + 11 + 13 = \underline{\hspace{4em}}$. First of all, it is easy enough to add these numbers either in your head or with a calculator. We get that $1 + 3 + 5 + 7 + 9 + 11 + 13 = 49$. This problem doesn't really seem complicated enough for a calculus problem, but the point of this problem is to discuss some shorthand notation for adding (summing) numbers. In mathematics we often look for symbolic notation to shorten our writing of a problem. The Greek letter sigma $\Sigma$ is used when we want to add (sum) expressions. In the previous problem, it appears that we are adding odd integers from 1 to 13 and one way to represent an odd number is to write it as $2k + 1$, where k is any integer. However, here we need to be careful because we don't want all of the odd integers. We need to figure out where k should start and stop so that our first odd integer is 1 and last odd integer is 13. Hopefully, you have thought about it and will now agree that the original problem can be written in shorthand as the following.
| The symbol $\Sigma$ tells us that we need to add several terms, starting with the number attained by plugging $k = 0$ into the formula. Then we sum all values obtained by evaluating the formula for every integer value of k up to and including $k = 6$. | $\sum\limits_{k \;=\; 0}^{6}{(2k + 1)}$ | This is the formula that will give an odd integer. You may observe that we could have used the formula $2k - 1$ as well, but we would have different starting and ending values for k in that case. |
Now that we have taken a sum and written it using summation notation, we can go in the other direction and expand a sum written in summation notation.
Example 10.1:
Write the sum in expanded form and find its value.First of all, this problem seems somewhat confusing because the index, i, doesn't appear in the formula behind the summation sign. So, we need to think a little bit about what the index is telling us. The index can be thought of as a way to keep track of the terms. The value of i beginning at 1 and ending at 7 indicates that we have 7 terms. This means that we need to add 3 seven times. Therefore, the expansion would be as follows.
| $\sum\limits_{i \;=\; 1}^{7}{3} =$ | $ \;3 \;+\;$ | $ \;3 \;+$ | $ \;3 \;+$ | $ \;3 \;+$ | $ \;3 \;+$ | $ \; 3 \;+$ | $ \;3$ |
| $i = 1$, | $\;i = 2$, | $\;i = 3$, | $\ldots$ | $i = 7$ | |||
So now that we have expanded the sum, we need to find its value. Essentially, adding 3 each time seven times will give us 21 for the value of the sum.
In calculus, we often use the letters i, j, and k for the index and the top index on our sum is often going to be a variable, n. Therefore, we need to figure out how to deal with the following type of sum, expand it, and find its value.
Example 10.2:
Write the sum in expanded form and find its value.If we start with $i = 1$ and keep adding the integer values of i until we get to $i = n$, we will get the following.
| $\sum\limits_{i \;=\; 1}^{n}{3i} =$ | $ \;3 \;+\;$ | $ \;6 \;+$ | $ \;9 \;+$ | $ \; \ldots \;+$ | $ \;3n $ |
| $i = 1$, | $\;i = 2$, | $\;i = 3$, | $\ldots$ | $i = n$ |
Now we have the expanded sum, but how will we find its value? The following formulas will be very helpful when you work with Riemann Sums in calculus.
When working with sums, there are some basic rules that we will find helpful. These include:
- $\sum\limits_{i \;=\; 1}^{n}{c} \;a_i = c\sum\limits_{i \;=\; 1}^{n}{a_i}$
- $\sum\limits_{i \;=\; 1}^{n}{(a_i + b_i)} = \sum\limits_{i \;=\; 1}^{n}{a_i} + \sum\limits_{i \;=\; 1}^{n}{b_i}$
- $\sum\limits_{i \;=\; 1}^{n}{(a_i - b_i)} = \sum\limits_{i \;=\; 1}^{n}{a_i} - \sum\limits_{i \;=\; 1}^{n}{b_i}$
In addition, we have the following formulas for c a constant and n a positive integer.
- $\sum\limits_{i \;=\; 1}^{n}{c} = n \cdot c$
- $\sum\limits_{i \;=\; 1}^{n}{i} = \dfrac{n(n + 1)}{2} = \dfrac{n^2 + n}{2}$
- $\sum\limits_{i \;=\; 1}^{n}{i^2} = \dfrac{n(n + 1)(2n + 1)}{6} = \dfrac{2n^3 + 3n^2 + n}{6}$
- $\sum\limits_{i \;=\; 1}^{n}{i^3} = \left[\dfrac{n(n + 1)}{2}\right]^2 = \dfrac{n^4 + 2n^3 + n^2}{4}$
Which of these formulas seem helpful for example 10.2? First we write $\sum\limits_{i \;=\; 1}^{n}{3i} = 3 \cdot \sum\limits_{i \;=\; 1}^{n}{i}$ using Formula 1. Once we do this, then it seems that we need to use formula b. Using this formula, we can find the value of the sum in terms of the variable n. We have that
The Concept of Area
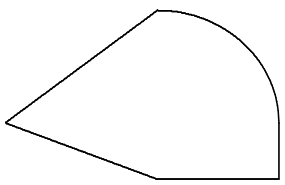
If you were given the following figure, how would you determine the enclosed area?
Figure 10.1 |
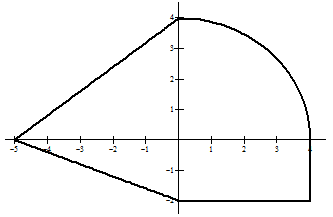
Figure 10.2 |
|
|
Would the problem be easier if you were given a coordinate system as in Figure 10.2?
We hope that you will think a bit and get the idea that you need to break the figure into smaller geometric figures, compute the area of these smaller figures, and then add the areas together to find the total enclosed area. One way to break it up is pictured in Figure 10.3.
Figure 10.3
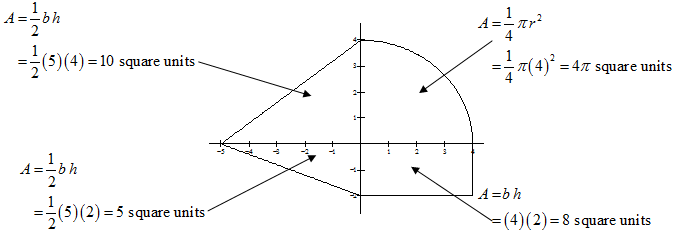
Now we have 4 smaller areas and we can recognize them as two triangles, one quarter of a circle, and a rectangle. We compute the areas of each of them and find that the total enclosed area is $(10 + 5 + 4\pi + 8) = (23 + 4\pi)$ square units.
In calculus, the area problem will likely look something like Figure 10.4. This region represents the area between the curve $f(x) = \frac{1}{2}x^2$ and the x-axis on the interval $[0, \,4]$.
Figure 10.4
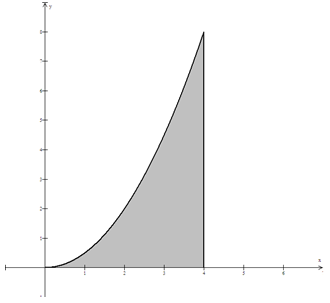
One way to estimate this area would be to split it up into smaller geometric figures so we can calculate their area. In Calculus I, we often use rectangles to estimate the area of a shaded region between a graph and the x-axis. Let's say that we are going to split the shaded region into 4 rectangles of equal width. Why might 4 intervals be a good choice?
Figure 10.5
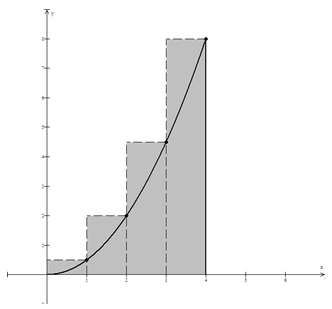
Let's use Figure 10.5 to estimate the area of the shaded region. Since the interval is $[0, \,4]$, it is easy to see that each rectangle has a width of 1 unit. We can think of it as splitting the large interval into the following smaller intervals:
Now observe that the height of each rectangle corresponds to the point on the curve for each of the x-values 1 through 4, the right-hand endpoints of each of the subintervals.
In fact, we can write the sum of the areas as follows.
| Width of the rectangle. Each one is $\require{color}\fcolorbox{white}{#fbff66}{1}$ unit wide. |
$\require{color}\fcolorbox{white}{#fbff66}{1}$ | $\cdot$ | $f(1)$ | $+$ | $\require{color}\fcolorbox{white}{#fbff66}{1}$ | $\cdot$ | $f(2)$ | $+$ | $\require{color}\fcolorbox{white}{#fbff66}{1}$ | $\cdot$ | $f(3)$ | $+$ | $\require{color}\fcolorbox{white}{#fbff66}{1}$ | $\cdot$ | $f(4)$ |
| Height of first rectangle. |
Height of second rectangle. |
Height of third rectangle. |
Height of fourth rectangle. |
If we evaluate the function at each of the indicated x-values, we have $f(1) = \frac{1}{2}$, $f(2) = 2$, $f(3) = \frac{9}{2}$, and $f(4) = 8$. The sum of the estimated area becomes $1 \cdot \frac{1}{2} + 1 \cdot 2 + 1 \cdot \frac{9}{2} + 1 \cdot 8 = 15$. Our picture shows that our estimate for the area of the shaded region is larger than the actual area. Why?
What would happen if we used eight rectangles instead of four? This situation is pictured in Figure 10.6 below.
Figure 10.6
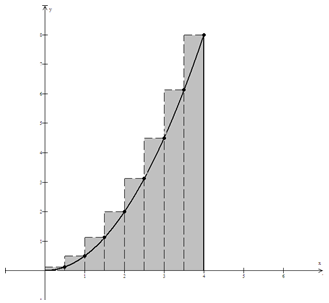
Now the width of the rectangles is 1/2 unit instead of 1 unit and we have the following subintervals.
Again, the height of each rectangle is represented by plugging the right-hand endpoints of the subintervals into the function. Thus, we can estimate the area by the following.
Does this estimate for the area of the enclosed region in Figure 10.4 seem better than the estimate with four rectangles? How many rectangles do you think would be needed to get a reasonable estimate? This question will be discussed at length in your calculus class.