- Contents >
- A Note About the Graph Scaling

A Note About the Graph Scaling
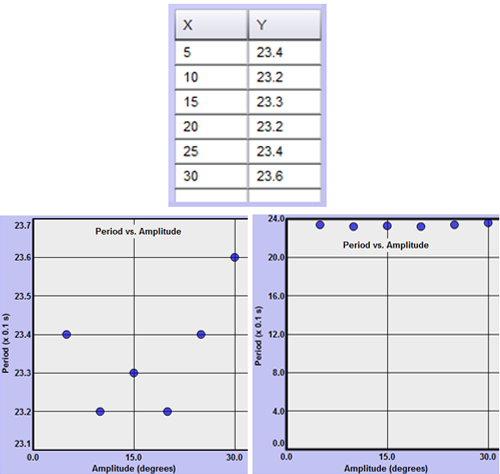
Many people have an important learning experience with the first two graphs in the Motion of a Simple Pendulum lab due to their choice of graph scales. When it says in the introductory materials to always start a graph at (0, 0), it seems pretty innocuous. The two graphs in Figure 1 below should clarify this. Both graphs use the same data but the minimum y-value differs in the two graphs.
The graph on the left looks like it might represent some sort of complex curve. And without looking too carefully, you might conclude that the second point's y-value is one third of that of the first point. Nearly any graph will do something like this if you compress the scale enough. For a graph to reflect the true relationships, the scales must start at zero for each axis. That's what the graph on the right illustrates. When graphed correctly it's clear that there's very little variation in the dependent variable, the period.
(We sometimes ignore this rule to reduce the graph size, but only when we're certain that our audience knows to beware. In these cases you may see the vertical axis broken by a ≈ graphic to indicate that some of the graph has been removed. We will avoid using this technique in our labs.)
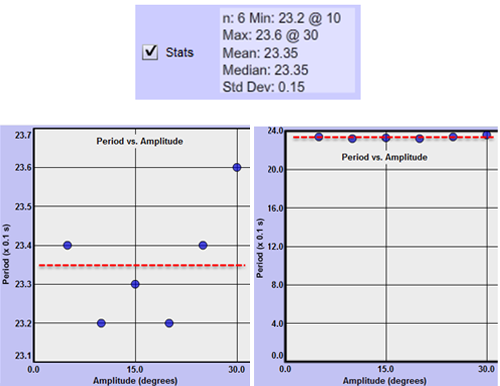
In the next figure, the data was selected and the "Stats" tool was used to find the mean value of the period for this data. In each graph, a dashed line has been inserted representing the mean.
The six data points vary by 0.2%, –0.6%, –0.2%, –0.6%, 0.2%, and 1.1% from the mean. So they're all very close to lying on a line as shown in the graph on the right. Note that this doesn't mean that this set of data indicates a linear relationship. Instead it indicates that there's no relation between the period and the amplitude. That is, according to this data, changing the amplitude has no effect on the period. As you'll see elsewhere in the lab, there actually is a subtle relationship between the period and the amplitude. But the data used in this essay is not precise enough to demonstrate it.
The lesson is that you have to start a graph at (0, 0) if you want to see the relative changes of the data. Misleading, compressed graphs are a favorite of people with political, economic, and social axes to grind. Be looking for it next time an election rolls around.