Skewed Data Sets
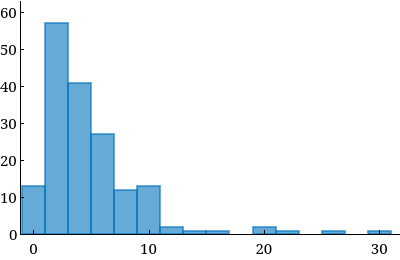
In common language, something that is skewed is off-center in some way. In statistics, a skewed data set is one that is basically unimodal but is substantially off from being bell-shaped. If it is skewed to the right, the higher values are more spread out than the lower values. Notice that a histogram that is skewed to the right extends further to the right of the highest peak (the tallest bar) than to the left. The figure below is an example of data skewed to the right.

The histogram has a horizontal axis with values from 0 to 30 and a vertical axis with values from 0 to 60. The histogram has 13 bars. Each bar is associated with a label and an approximate value as listed below.
- 0: 13
- 2: 57
- 4: 41
- 6: 27
- 8: 12
- 10: 13
- 12: 2
- 14: 1
- 16: 1
- 20: 2
- 22: 1
- 26: 1
- 30: 1
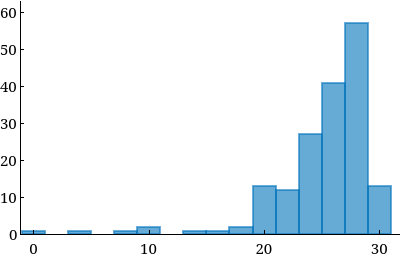
If a data set is skewed to the left, then the lower values are more spread out and the higher ones tend to be clumped. Most students think the terminology should be the other way around, so be careful to learn this definition! The direction of the "skew" is the direction with the unusual values, and not the direction with the bulk of the data. The figure below is skewed to the left.

The histogram has a horizontal axis with values from 0 to 30 and a vertical axis with values from 0 to 60. The histogram has 13 bars. Each bar is associated with a label and an approximate value as listed below.
- 0: 1
- 4: 1
- 8: 1
- 10: 2
- 14: 1
- 16: 1
- 18: 2
- 20: 13
- 22: 12
- 24: 27
- 26: 41
- 28: 57
- 30: 13
The mean and median for a set of measurements can be very different from each other if there are outliers or extreme skewness in the numbers. In general, the mean and median are approximately the same in a symmetrical distribution. If the data is skewed to the left, the mean is less than the median. If the data is skewed to the right, the mean is greater than the median. The median is generally a more appropriate representation of a "typical" value for a skewed data set, as the mean is influenced by outliers.