
Appendix I: Adding Title and Label to a Graph
A graph is not complete without a title and axes labels. This tutorial shows you how to add a title to your graph and label the axes in a few easy steps.1
Right click the graph and select Chart Options.
2
Click the title tab.
3
Type the chart title in the Chart title box.
4
Type the labels for the y and x axes in the appropriate fields.
5
Click OK.
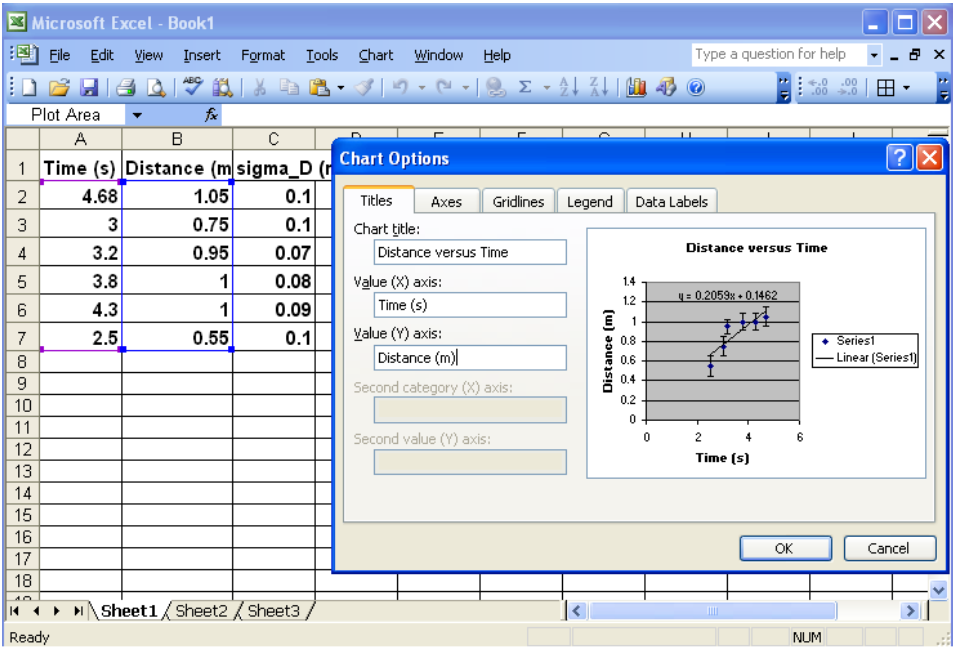
Figure 1: Adding a chart title and axes labels
After you add a chart title and axes labels, your graph should look like Fig. 2.
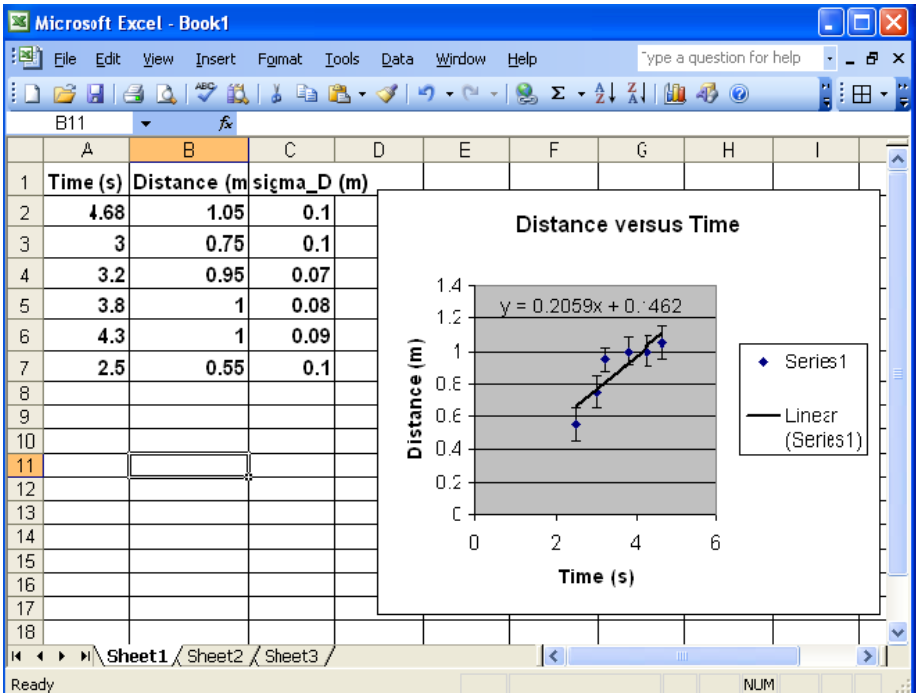
Figure 2: A complete graph