The Pendulum
Back to TopObjectives
-
•to determine what characteristics of the pendulum change the period of oscillations
-
•to calculate the experimental mass of Earth
Equipment
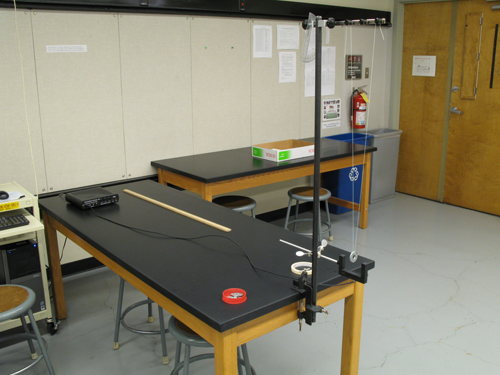
set of 6 identical washers that will act as the simple pendulum, support stand with a photogate connected to the Science Workshop Interface, meter stick, protractor
Figure 1
Introduction and Theory
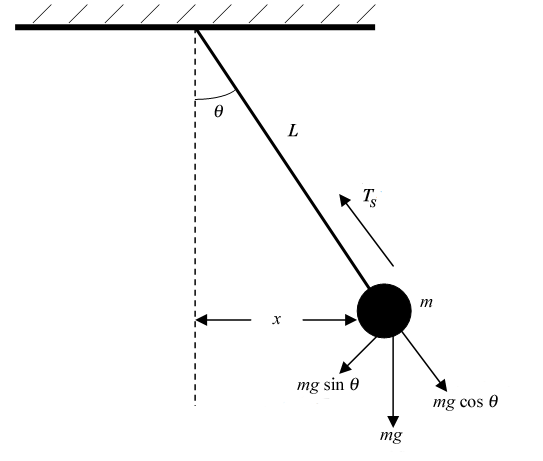
A simple pendulum consists of a point mass and a string. The size of the bob should be at least 10 times smaller than the length of the string that is holding it. The point mass is suspended at one end of the string, and the other end of the string is held fixed. The motion of a pendulum takes place in a vertical plane as illustrated in Fig. 2, where the angle θ is measured from the vertical line to the string. This initial angle is called the amplitude.
Figure 2: The force diagram for a pendulum
ar = v2/r
is the radial acceleration. In the other direction, the sum of the forces is
where at is the tangential acceleration and is equal to −g sin(θ).
This acceleration is tangent to the path of the pendulum at every point.
If the angle θ is sufficiently small, then sin(θ) ≈ tan(θ) ≈ x/L,
and equation 2 becomes
Equation 3 is the equation for simple harmonic motion, and from this, the period of the pendulum can be determined to be
The motion of the pendulum is periodic in time, which is the basis for pendulum clocks.
If the angle θ is not small, sin(θ) has to be expanded into an infinite series, and the result for the period becomes
Note that equation 5 can be used to estimate the error in the period when θ is not small. For example, when θ = 10°,
which is approximately a 0.2% error. Additional information about the pendulum can be found in your textbook.
Video
View the video below prior to beginning your lab.Procedure
Please print the worksheet for this lab. Answer all the questions on the Lab Worksheet prior to submitting the Inlab in WebAssign.Checkpoint:
Be sure to have your TA sign your lab worksheet, printed Inlab, and all printed graphs after each part is completed. Be sure the data can be seen on the graphs.
Be sure to have your TA sign your lab worksheet, printed Inlab, and all printed graphs after each part is completed. Be sure the data can be seen on the graphs.

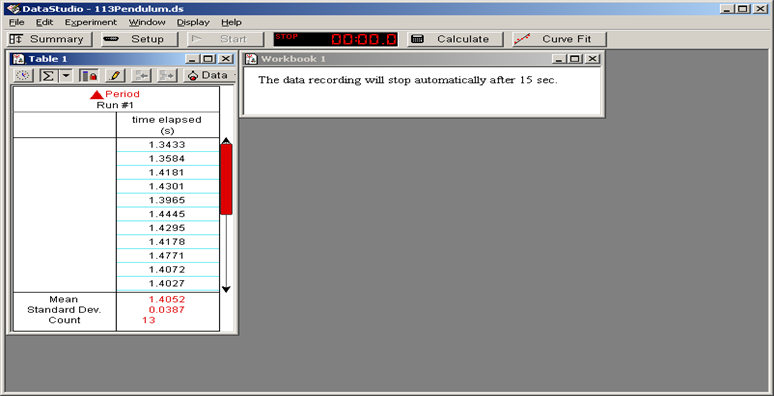
Figure 3: A sample of the DataStudio file for the pendulum exercise

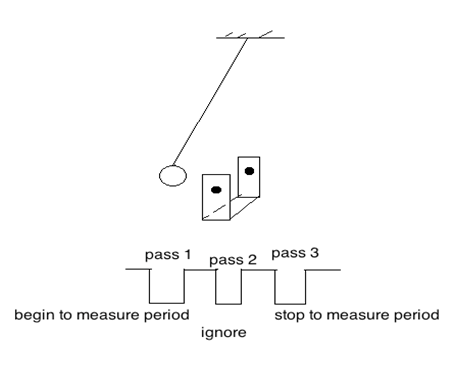
Figure 4
Be aware that the photogate can get confused if the string crosses the beam or if the beam passes through the opening in a washer. Use masking tape to close the opening in a washer. Always keep an eye on the pendulum while it is swinging so that it does not drift into a collision with the delicate and expensive photogate.
Part 1: Measure the period of oscillations for pendulum bobs of different masses while keeping the length of the pendulum and amplitude fixed.
Allow the mass to swing back and forth a couple of times before you start making measurements to let the pendulum "settle." To start the data acquisition, press the Start button on the tool bar menu. Use small amplitudes (angles) of about 5°.1
Put one washer at the end of the string. In GA, create columns to record the mean values of periods (in seconds) and the number of washers. All of the washers have the same mass, so the number of washers is proportional to the mass of the pendulum bob, and mass will be measured in number of washers. Start the timer in DataStudio. It will stop automatically in 15 s. In GA, record the mean value of the period shown in DataStudio.
2
Continue changing the mass of the pendulum by adding one washer at a time. Measure the period of oscillations for each mass. Keep recording the mean value of the period and the number of washers in GA.
3
In GA, make a graph of the pendulum period (the mean value) vs. the mass (the number of washers).
4
Record the slope and its uncertainty of the period vs. mass graph in the Inlab in WebAssign and answer the questions.
Part 2: Measure the period of oscillations for pendulum bobs at different amplitudes while keeping length and mass fixed.
1
Place two washers on the string. Start the timer in DataStudio. It will stop automatically in 15 s. Record the mean value of the period in GA that corresponds to each amplitude.
2
Repeat measurements of the period of oscillations for angles 3°, 5°, 8°, 10°, 12°, 15°, 18°, 20°, 25°, 30°, and any angle between 40° and 70°. In GA, create columns to record the mean value of the period and the starting amplitudes (angles). Make a bar graph of period vs. amplitude.
3
What conclusion can you make about the relationship between the period of oscillations and amplitude (maximum angle) for a simple pendulum?
Part 3: Measure the period of oscillations for pendulum bobs while varying length.
Keep the initial angle (i.e., 3°) and mass (two washers) constant. The length of a simple pendulum is the distance from the pivot point to the center of mass of the pendulum bob.1
Measure the period of oscillations for 6 different lengths of the pendulum.
2
Enter your measured values of the period T (the mean value) and corresponding length L into GA. Create a new calculated column for the value of  | L |
T vs.
and apply "Linear Fit" from the "Analyze" pull-down menu. The slope of this graph and its error will allow you to determine the acceleration due to gravity g and the error. Record the slope of the graph and its error in the Inlab. Take a screenshot of the graph to upload in the Inlab. Use the slope value to calculate the value of g.
 | L |
3
Calculate the percent discrepancy between your experimental and theoretical values of gravitational acceleration.
Calculating the Mass of Earth
Since the factor of g occurs in the period of a pendulum, it is possible to use the measurements taken above to determine the mass of the Earth. The acceleration due to gravity near the surface of the Earth is defined as Since G, ME and rE have fixed values, all objects near the surface of the Earth, regardless of their mass, are subject to the same acceleration. Substituting this expression for g into equation 4T = 2π
.
for the period of the pendulum we get
For one of your trials above, you might want to use the measured length of the pendulum and the average period as determined by DataStudio to compute the mass of the Earth. Compare it with the accepted value of  |
|
5.97 × 1024 kg
by calculating the relative discrepancy.
Adapted from PASCO scientific at pasco.com.


